reading-notes
Pandas
Pandas is a library used for data structures and data analysis
import
import numpy as np
import pandas as pd
Create Object
Series
s = pd.Series([1, 3, 5, np.nan, 6, 8])
Creates default index values
0    1.0
1    3.0
2    5.0
3    NaN
4    6.0
5    8.0
dtype: float64
DataFrame
- Primary pandas data structure
Example: Pass in dict
df2 = pd.DataFrame(
     {
         "A": 1.0,
         "B": pd.Timestamp("20130102"),
         "C": pd.Series(1, index=list(range(4)), dtype="float32"),
         "D": np.array([3] * 4, dtype="int32"),
         "E": pd.Categorical(["test", "train", "test", "train"]),
         "F": "foo",
    }
)
     A          B    C  D      E    F
0  1.0 2013-01-02  1.0  3   test  foo
1  1.0 2013-01-02  1.0  3  train  foo
2  1.0 2013-01-02  1.0  3   test  foo
3  1.0 2013-01-02  1.0  3  train  foo
View Data
df.head(num)- can optionally set number of rowsdf.tail(num)- can optionally set number of rowsdf.index- gets indexesdf.columns- get column namesdf.to_numpy()- return numpy representation (expensive for mixed types)df.describe()- quick stats (count, mean, std, min, etc)df.T- transposedf.sort_index(axis=1, ascending=False)- sort by indexdf.sort_values(by="B")- sort by value(column name)
Selection
df["A"]- Selects column “A”, same as df.Adf[0:3]- Selects first 3 rows
Selection by label
df.loc[dates[0]]- Cross section with dates labeldf.loc[:, ["A", "B"]]- multi-axis by labeldf.loc["20130102":"20130104", ["A", "B"]]- label slicing, inclusivedf.at[dates[0], "A"]- specific value
Selection by position
df.iloc[3]- 3rd row, all columns, transposed. Inclusive.df.iloc[3:5, 0:2]- 3rd-5th row, 0-2 column. Like NumPy/Python.df.iloc[[1, 2, 4], [0, 2]]- List explist row/col to includedf.iloc[1:3, :]- Explicit rowsdf.iloc[:, 1:3]- Explicit coldf.iat[1, 1]- Explicit row/col
Boolean indexing
df[df["A"] > 0]- Select rows matching column criteriadf[df > 0]- Select all values meeting criteriadf[df["E"].isin(["two", "four"])]- Finds rows meeting column criteria
Setting
df["F"] = s1- add a new column (where s1 is a Series)df.at[dates[0], "A"]- by labeldf.iat[0, 1]- by positiondf.loc[:, "D"] = np.array([5] * len(df))- with numpy arraydf[df > 0] = -df- turn all values greater than 0 negative
s1 = pd.Series([1, 2, 3, 4, 5, 6], index=pd.date_range("20130102", periods=6))
                  A         B         C  D    F
2013-01-01  0.000000  0.000000 -1.509059 -5  NaN
2013-01-02 -1.212112 -0.173215 -0.119209 -5 -1.0
2013-01-03 -0.861849 -2.104569 -0.494929 -5 -2.0
2013-01-04 -0.721555 -0.706771 -1.039575 -5 -3.0
2013-01-05 -0.424972 -0.567020 -0.276232 -5 -4.0
2013-01-06 -0.673690 -0.113648 -1.478427 -5 -5.0
Missing Data
df1.dropna(how="any")- drop downs w/ NaNdf1.fillna(value=5)- fill missing data
Operations
df.mean()- mean per columndf.mean(1)- mean per rowdf.apply(np.cumsum)- apply function to all columndf.apply(lambda x: x.max() - x.min())- apply function to get 1 val per columns.value_counts()- histogram for seriess.str.lower()- lowercase for series (more string methods exist too)
Merge
pd.concat(list of rows)- Concat pandas objectspd.merge(left, right, on="key")- sql style join (left and right are df’s)
Grouping
df.groupby("A").sum()
Reshaping
- Stack
- Pivot tables
Time series
ts.resample("5Min").sum()- Samplingts_utc.tz_convert("US/Eastern")- Time zone conversionts.to_period()- Convert to diff period
Categoricals
df = pd.DataFrame(
     {"id": [1, 2, 3, 4, 5, 6], "raw_grade": ["a", "b", "b", "a", "a", "e"]}
)
df["grade"] = df["raw_grade"].astype("category")- Convert raw to categoydf["grade"].cat.categories = ["very good", "good", "very bad"]renamedf.sort_values(by="grade")- Sortdf.groupby("grade").size()- Group by
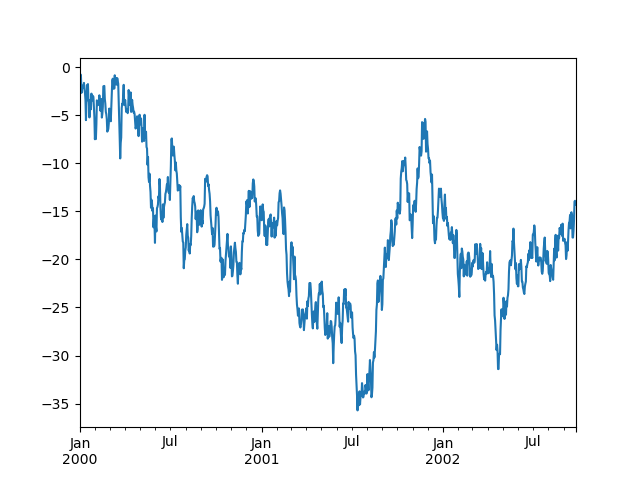
Plotting
import matplotlib.pyplot as plt
plt.close("all")

ts = pd.Series(np.random.randn(1000), index=pd.date_range("1/1/2000", periods=1000))
ts = ts.cumsum()
ts.plot()
plt.figure()df.plot()plt.legend(loc='best')

Getting data in/out
df.to_csv("foo.csv")- write to csvpd.read_csv("foo.csv")- read from csvdf.to_excel("foo.xlsx", sheet_name="Sheet1")- write to excelpd.read_excel("foo.xlsx", "Sheet1", index_col=None, na_values=["NA"])- read from excel